iif capital flows to emerging economies1:sunshine coming out...
title:iif capital flows to emerging economies1:sunshine coming out, but bring an umbrella
author: garbis iradian , gene ma
after bottoming out over the past two years, the momentum of nonresident capital flows to emerging markets (ems) has shifted in the opposite direction. this in large part because the outlook for ems is now seen as more positive relative to advanced economies, with average em output growth likely to be higher and em interest rate spreads likely to widen. china is likely to see a modest turnaround in net nonresident capital inflows this year and next following the substantial drops in the past two years. the improved economic performance, business conditions, and beijing's renewed efforts to woo foreign investors should facilitate capital inflows. the derisking, reshoring, and technology embargo by the us and other countries remain major downside risks for china-bound capital flows.
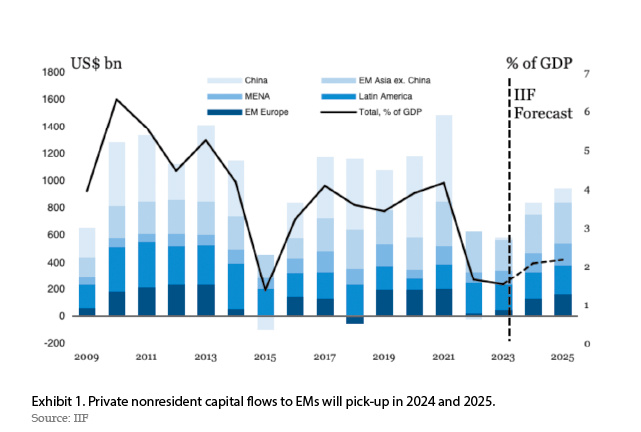
capital flows to emerging market countries will improve
em economic growth remains robust as advanced markets’ growth slows. underlying our projections for improvement in inflows this year and in 2025 is the global macro-outlook where growth is led by an acceleration in ems, and significant cuts in policy rates in advanced economies. we forecast global growth of 3.1% in 2024 and 2.9% in 2025. nonetheless, a global “soft landing” scenario makes for a positive picture. growth in advanced economies is set to slow amid the lagged effects of tight monetary policy and withdrawal of fiscal support, while growth in ems will generally remain quite robust. the progress toward the 2% inflation target will vary among advanced economies. since february, expectations for fed easing have been pushed back. our base case assumes that price increases would start to cool again in the second half of this year, and we have penciled a 25 basis points (bps) cut in september or october of 2024 and a cumulative easing of 125 bps in 2025, with the fed rate being lowered to 3.7% by end-2025, when cpi inflation converges to 2%. for the euro area and the uk, we expect rapid progress toward the inflation target, with the first cut in the policy rate in either june or july.
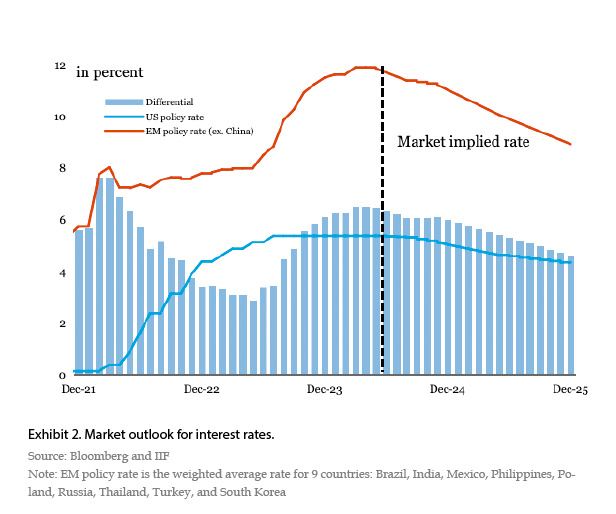
prospects for em portfolio flows hinge crucially on decreases in policy rates in advanced economies (exhibit 2). most ems have been resilient to the unfavorable external environment (including tight financial conditions, geopolitical risks, and subdued global trade). growth remained strong, inflation has eased significantly in most ems in response to early and pre-emptive monetary tightening, most notably in latin america and asia pacific. on average, ems’ central banks raised policy rates by 800 bps from mid-2021 to mid-2023, compared with 400 bps in advanced economies. as progress has been made in reducing inflation, many central banks in ems have started cutting rates. the nominal interest rate differential has widened between ems and the united states to 6.5 percentage points in the first five months of this year.
we expect total capital inflows to increase by around $220 bn to $903 bn in 2024, driven by the strong recovery in fdi and portfolio equity. we now estimate that nonresident capital flows to ems edged up to $682 bn in 2023, equivalent to 1.8% of gdp, half the average of 3.6% between 2010-2019. flows to local currency bond and equity markets in ems were robust in the first four months of 2024. fdi inflows to ems are also noticably larger than portfolio and other investment inflows. for instance, in latin american countries, fdi inflows account for about 80% of total nonresident inflows destined mainly to brazil and mexico. fdi to poland, indonesia, and the uae have held up relatively well, while china and russia have accounted for most of the decline in fdi. in general, asia (with the exception of south korea) saw less fdi flows, both as a source and host, losing market share vis-à-vis other regions. portfolio capital inflows will continue to increase as the interest rate spread between ems and advanced economies widens. we expect portfolio equity investment inflows to ems to more than double to $101 bn in 2024, albeit from a very low base, driven by the modest recovery in china.
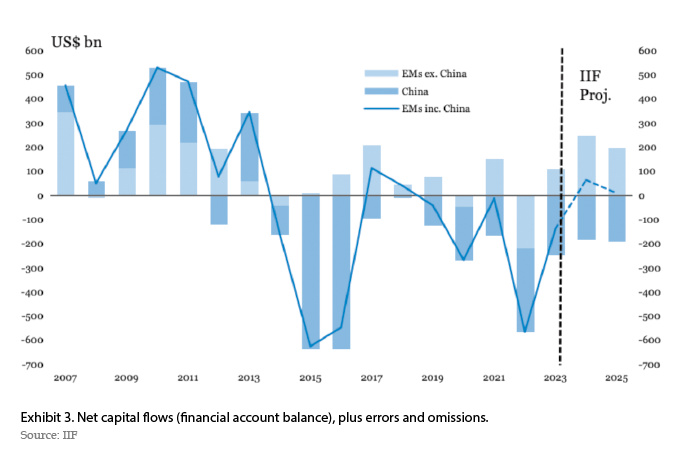
aggregated resident capital outflows will remain high at $848 bn in 2024. these outflows are the combination of a number of different factors. first, we expect some outward fdi stemming from setting up production bases overseas to be closer to markets, more efficient supply chains, and the acquisition of foreign technology and natural resources. second, part of these outflows could stem from portfolio diversification reasons, with east asia and the gulf cooperation council (gcc) standing out. third, resident outflows are also expected to reflect large nonresident capital inflows in excess of the current account financing requirements. fourth, we see some space for policy-induced lending abroad. most portfolio equity outflows from ems are destimed to advanced economies, particuarly the us, while portfolio debt outflows are more invested in other ems and developing economies. taking into consideration resident capital outflows, net capital outflows to ems (including unrecorded flows captured by net errors and omissions) over the past two years are projected to shift to small net inflows in 2024 and 2025 (exhibit 3).
what are the downside risks? our baseline scenario is arguably a relatively benign one, with a soft landing in advanced economies, robust growth in ems, and monetary easing in advanced economies. we stress downside risks to our capital flows outlook related to (1) weaker global growth; (2) increasing geopolitical tensions with potential effects not only on the real economy but also on market sentiment and risk appetite; and (3) delayed fed rate cuts that could be prompted by continued sticky inflation in the united states. growth in china could be lower than in our baseline due to the weakness in the property market and inadequate fiscal support. indeed, high frequency indicators have shown mixed signs of a recovery in china in recent months.nonetheless, most major ems have weathered well in an unfavorable external environment, including rising political tensions and tight global financial conditions over the past two years. such resilience was supported by improved policy framework and economic fundamentals. countries with relatively large current account deficits, high levels of fx corporate indebtedness and questionable macro policy frameworks may face increased challenges in raising financing from the international market. 2
china: modest recovery in capital inflows
net nonresident capital flows will recover modestly in 2024 and 2025, after substantial drops in 2022 and 2023.
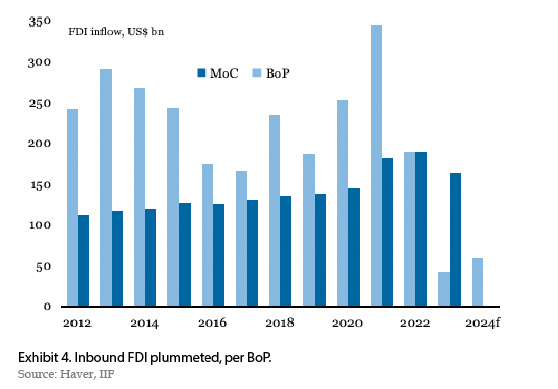
china's inbound fdi in 2023, as reported by the ministry of commerce, dropped by 14% to $163 bn (exhibit 4). there were fewer chinese ipos in the united states and thus ipo funds repatriated back to china (as the us administration discouraged investments in chinese technology companies). inbound pe/vc investment with a stake of over 10% vanished (as profits dropped amid deflation in china). there were fewer retained or reinvested profits by foreign companies, as the cny-usd spread turned from a premium of over 300 bps to a discount after the fed hikes and pboc cuts, and foreign businesses repatriated their profits out of china and sent in fewer intra-company loans. all the flows mentioned above are counted as fdi in the bop, but not by the ministry of commerce. we believe the bop fdi should recover modestly in 2024 to $57 bn, as the fed cuts rates and corporate profits recover in china. the outbound fdi may slightly pick up to $190 bn, as chinese businesses need to diversify their supply chain to reduce de-coupling risk.
china experienced a huge swing in foreign portfolio flows over the past two years. nonresident bond inflows were only $7 bn last year, after a record outflow of $147 bn in 2022 and a record inflow of $166 bn in 2020. foreign bond inflows resumed last september after the market expected the fed to reverse its course on interest rates (exhibit5). the sharp rebound of bond inflows in november coincided with china's issuance of special central government bonds (cgbs). as investors expect pboc to remain dovish, we expect the foreign bond flow to recover modestly to $54 bn in 2024.
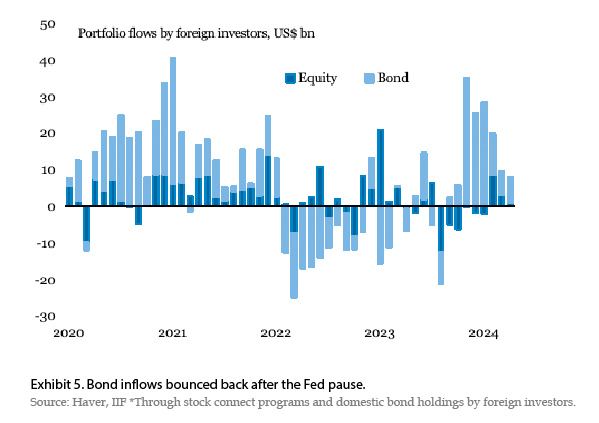
foreign equity flows have been volatile in the past few years due to economic, policy, and geopolitical uncertainties. given the attractive valuation, recent efforts to enhance the market regulation, and the likely improvement in earnings, we expect the nonresident equity flows in 2024 to be a small inflow of $25 bn. further recovery in equity inflows would require clear signs of reflation in the economy.
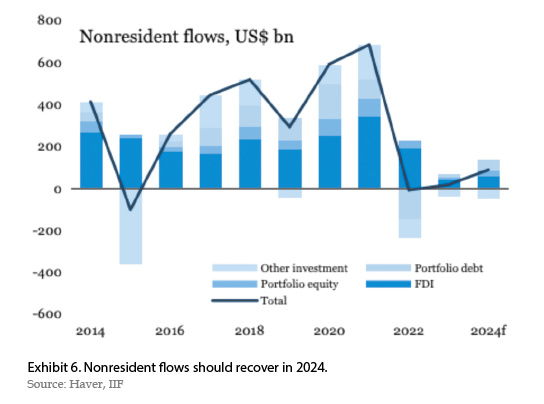
the relatively higher usd interest rate also led to the outflows of other investments (oi) in 2022 and 2023, as the foreign businesses found onshore rmb deposits unattractive and foreign bank loans and trade credits were more expensive than their rmb counterparts. we expect oi flows to be roughly balanced in 2024.
we expect china's economy to recover further and grow by 5% in 2024. the improved economic performance, business conditions, and beijing's renewed efforts to woo foreign investors should facilitate capital inflows. the derisking, reshoring, and technology embargo by the us and other countries remain major downside risks for china-bound capital flows.
garbis iradian is the chief economist of mena in iif
gene ma is the head of china in iif
1. released twice a year, this iif flagship capital flow report provides a comprehensive assessment and forecasts of flows for 25 emerging markets.
2. for detailed discussion on capital flows by region, as well as insights into key emerging markets such as india, brazil, and mexico, please refer to the full version of the iif capital flow report available at www.iif.com.


